Spending Review disappoints property industry
Early in September, Chancellor Sajid Javid announced extra funding for local authorities, but the property industry has expressed disappointment that the Spending Review did little to benefit housing and planning.
Melanie Leech, Chief Executive of the British Property Federation said: “Additional funding for local authorities is much needed and welcome. However, the Spending Review offers little to support new housing delivery or overstretched planning departments.”
She went on to point out that local authorities, working in partnership with the property industry have a vital role to play in alleviating the housing crisis and rejuvenating the UK’s struggling town centres.
Brian Berry, Chief Executive of the Federation of Master Builders (FMB) welcomed the announcement of the Towns Fund of £241 million, which is to be spent on the regeneration of high streets, town centres and local economies. However, he commented: “This must be part of an overarching strategy for new build homes and social housing, which will be key to securing a prosperous post-Brexit Britain. What’s more, we need a retrofit strategy to ensure that our existing homes are fit for the future, and to alleviate the scourge of fuel poverty.”
UK rents reach record high
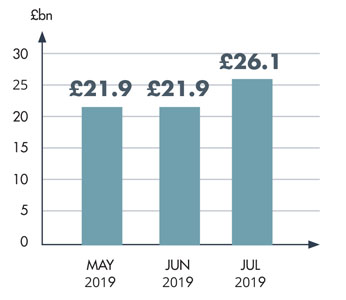
The latest figures from the Association of Residential Letting Agents (ARLA) show the cost of renting rose for the third month in a row, to reach the highest figure on record. The July figures saw almost two thirds (63%) of agents seeing landlords increasing rents, which is a 15% increase from the previous record high in June.
The figures also show that the number of tenants experiencing rent increases was up 31% compared to July 2018, with tenants in the West Midlands worst affected, where 86% experienced a rent increase.
David Cox, Chief Executive of ARLA said: “Following the Tenant Fees Act coming into force in June, rents have continued to rise, which we believed would happen. The fees agents have been banned from charging are still being paid for by tenants, however it’s now through their rent, rather than upfront costs.”
He also commented that a fall in the number of properties available has increased competition and increased levels of legislation have added more pressure on landlords, resulting in more leaving the industry or feeling the need to increase rents.
Price growth strong in Scotland and Wales
The latest UK Housing Market Update from Savills, states an expectation that average house price growth will remain flat throughout 2019, revised down from a predicted growth of 1.5%, made in November 2018, under an assumption of an orderly Brexit.
The update states that uncertainty has increased in the residential market since July and will continue to shape the market until the Brexit impasse is resolved.
Wide regional variations in growth continue to be evident. Interestingly, over the last year, nine of the top ten highest price growth local authorities were in Scotland and Wales, led by West Dunbartonshire (11.6%) and Blaenau Gwent (17.9%). In contrast, London was the weakest region, containing six of the bottom ten local authorities for price growth. |